

Aqueduct and Irrigation Networks

Figure 1 Rio San Martino reservoir of the ACM del Mirese aqueduct (VE)

Figure 2 Rio San Martino reservoir of the ACM del Mirese aqueduct in the HydNet (VE) model scheme
1D Mathematical Models of Pressure Networks
The 1D mathematical model of pressure networks was developed by CREA S.r.l. to analyze all the aspects involved in the study of pressure networks, from the analysis of the current situation for the search for leaks to the search for the lowest cost solution for its design to the optimal management of the remote control bodies.
Specifically, the model was applied to aqueduct networks, sewers, and irrigation systems.
Our mathematical models allow:
- The most economical design of a newly built distribution network
- The extension and adaptation to support the greater demands of an already created network
- The analysis of various motion phenomena and in particular the pressure waves in the different hydraulic parts of the network (pipes, valves, air tanks, tanks, etc.)
- The management of aqueduct systems by optimizing all the multiple phases of management
- The evaluation of statistical parameters, the creation of model archives and databases, through the collection, reading, and processing of data from monitoring equipment placed in critical points on the network.
Significant References
- Mathematical model of the water distribution network of the Municipality of Pellestrina as part of the aqueduct system of the Veritas company (2008, Veritas Spa (VE)).
- Mathematical model of the Peschiera del Garda aqueduct (VR) (2006, AGS Consortium (VR)).
- General project relating to the restoration of the Mirese ACM aqueduct (2006, ACM (VE)).
- Hydraulic mathematical model of the water network of Chiampo (VI) aimed at finding leaks in the network (2002, Consorzio Acque del Chiampo (VI)).
- Hydraulic mathematical model of the Ghisalba aqueduct network (BG) aimed at finding leaks in the network (2001, Consorzio Bacino del Serio (BG)).
- Optimal design by minimizing the construction costs of the Spello (PG) aqueduct network (1999, ENEL-HYDRO).
• Evaluation of the phenomena of various motion for the adduction network of the irrigation system in a hilly area in the municipalities of Marostica and Pianezze (1999, Consorzio Pedemontano Brenta (PD)).
General characteristics of mathematical models
HydNet is a set of four application packages that embraces all the aspects involved in the study of pressure networks, from the analysis of the current situation for the search for leaks to the search for the lowest cost solution for its design to the optimal management of the organs of remote control. In particular, HydroNet was developed for the analysis of networks in conditions of permanent motion and the search for leaks, WatWork for the study of networks in conditions of various motion, SuperNet for the design and optimal adaptation of the networks, WatMan for management optimal of the remote-controlled organs.
In any case, these are powerful, easy-to-use tools, extremely useful for civil and hydraulic engineers, technicians and managers of bodies in the water sector.

Figure 3 Rio San Martino reservoir of the ACM del Mirese aqueduct (VE) in the GIS of the HydNet model
Mathematical Model Development Environment
HydNet, developed in the MicroStation environment, constitutes a real GIS system, in which mathematical models integrate in a completely natural way. For the use of the mathematical models, it is sufficient to “draw” the water network and the plants to be analyzed on the screen using the commands of the Preprocessor Menu, attribute the characteristics of the elements by choosing from a rich database managed by the Preprocessor itself, process the data and calculate the network with a simple “click” using the Postprocessor.
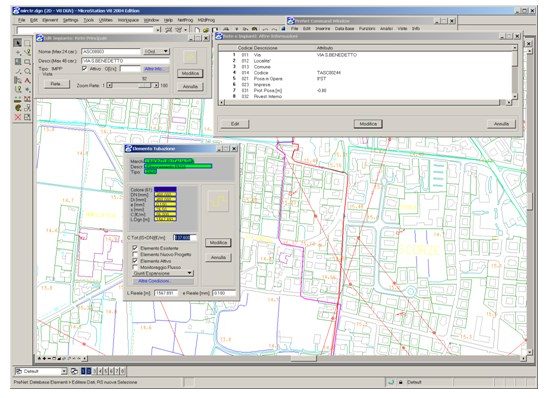
Figure 4 Representation in the GIS of the HydNet model of the pipes in Via San Benedetto a Noale (VE)
Development and analysis tools
Two different application packages operating in the MicroStation environment have been developed to prepare the physical characteristics of the networks and to display the results obtained with the mathematical models: the PreNet preprocessor and the PostNet postprocessor. With these tools, it is possible to represent, with the same degree of detail and on a unitary scale, both the characteristics of the main network and those of the plants.

Figure 5 Water balance obtained from the results of the HydNet model of the ACM Aqueduct of Mirese (VE)
HydroNet - Analysis of water networks under pressure
HydroNet, the mathematical model analysis of pressurized water networks, allows the study and comparison of different operating scenarios of the real water system, assessing any network deficiencies with particular reference to the search for leaks.

Figure 6 Simulation of the real management with remote control operated by the WatMan model on 3 June 2005 in the Campagna Lupia reservoir of the Mirese aqueduct (VE)
WatWork - Various motion in water pressure networks
WatWork, the mathematical analysis model of water networks under pressure in various motion, allows evaluating the results provoked by the maneuvers carried out with the different control organs inserted in the systems.
SuperNet - Optimization of pressure water networks
SuperNet,the mathematical model for optimizing pressurized water networks is a tool of great interest as it allows to determine the minimum cost solution in correspondence with different operating conditions of the network, simultaneously minimizing both the energy costs for the management of the hydraulic system and those of initial construction for the construction of the network.
WatMan - Management of pressure water networks
SuperNet,the mathematical model for optimizing pressurized water networks is a tool of great interest as it allows to determine the minimum cost solution in correspondence with different operating conditions of the network, simultaneously minimizing both the energy costs for the management of the hydraulic system and those of initial construction for the construction of the network.

Figure 8 Plan of operations of the spindle valve of Tank 2 of the Valle Cavallina aqueduct (BG) in the optimal management performed by the WatMan model.

Figure 9 Optimal management performed by the WatMan model of Tank 1, Tank 2 and Tank 4 of the Valle Cavallina aqueduct (BG). Performance of the levels in the three tanks.
CASE STUDY 1: Optimization of New York and Hanoi networks with SuperNet
In this section, two different case studies are presented, the New York Network Tunnel Problem (NYTP) and the Hanoi Network Tunnel Problem (HP). In both cases, in order to objectively evaluate the potential offered by this calculation tool, the comparisons between the solutions obtained from the proposed model and those published in the specific literature available are reported.
Case Study 1: New York Network
The water network of the city of New York consists of a network of large tunnels, operating under pressure due to gravity (Figura 7). In 1969 this system had to be adapted to the changing dimensions of the metropolitan area, which has grown enormously since the initial construction. As part of this work, particular attention was paid to the construction of parallel galleries to the existing ones. The actual project, carried out by Schaake and Lay [10], sought the solution relating to an optimal dimensioning, that is, one that satisfies the constraints of consumption and piezometric load in conditions of minimum construction cost.
Since 1969 the water network of New York city has been the subject of a long series of studies to determine its optimal configuration, thus making a direct comparison, under the same conditions of application, between the results obtained with the proposed model and those published by the most authoritative experts of the sector.
To make the comparison with the results obtained by the other researchers, the original data of New York water network were used, reported in full in an article published by Quindry [9]. The network consists of 21 pipes, to be doubled where necessary, corresponding to 20 nodes, which together form 2 different meshes.

Figura 7 New York water network schema.
The system is gravity-fed from a single tank and only one load condition is imposed. For each pipe it is possible to choose between 16 different diameters, shown in Tabella 1. For the calculation of the network a roughness coefficient equal to 100 was used in the Hazen-Williams formula, the same value published by Quindry in the article cited and used by all other researchers.
Tabella 2 shows the comparison between the loads calculated by the SuperNet model and the constraint loads imposed, while Tabella 3 reports the optimization results relating to the dimensioning of the different sections of the network with the SuperNet model.
Finally, Tabella 4 shows the comparison between the solutions obtained by the various researchers, using homogeneous data both as regards the unit costs of the pipelines and as regards the size of the network.
It is important to note that other authors (Savic & Walters [11]; Lippai et al. [7]; Wu et al. [12]; etc.) have proposed cheaper solutions which have proved to be inadmissible. The proposed model is very close to the best solutions obtained so far but, unlike the classical genetic models, the solution has been obtained with a very reduced computational effort, resulting in any case admissible.
In particular, it can be observed in Tabella 3 that the result obtained with the SuperNet model is very similar to that reported in the literature by Dandy [3] with the use of a genetic method GA, when the subdivision of the single trunks into two others of different diameter is prevented.
In fact, in the proposed model the initial solution, obtained with a self-adaptive GA genetic algorithm, constitutes only the starting point for an LPF heuristic algorithm that performs the final part of the optimization process.

Tabella 1 Disposal piping and related costs in case of New York NYTP network remaking problem

Tabella 2 Comparison between the calculated pressure values and those imposed as a constraint condition in case of New York NYTP network remaking problem. The values are the same as those used by other researchers

Tabella 3 Solution determined with SuperNet optimization model for New York City water network expansion problem. The total cost amounts to 38,664 [M $]. In (*) are also reported the values of the diameters in [in] obtained from the application of the genetic method by Dandy (1996). It can then be observed that the result obtained with the SuperNet model is practically the same as the latter if the subdivision of the individual trunks into two others of different diameters is prevented

Tabella 4 Comparison of the solution obtained with the model proposed for the problem of the expansion of the water network of the city of New York with that obtained in some previous studies, using homogeneous data both as regards the unit costs of the pipelines and as regards the size of the network . The solution of the proposed model is not the best in this case but is very close to the best solution obtained so far
Case Study 2: Hanoi network
The problem of the water network of the city of Hanoi (Fujiware & Khang) has also been considered by numerous authors (Savic & Walters [11]; Cunha & Sousa [2]; Wu et al. [12]; etc.). Unlike the New York NYTP network, this is a newly designed network and there are no existing piping in the system. The network, represented in Figura 8, consists of 34 pipes corresponding to 32 nodes, which together form 3 different meshes. The system is supplied by gravity from a single tank and a single load condition relative to a pressure of 30 [m] is imposed on all the nodes of the network. For each pipe it is possible to choose between 6 different diameters, shown in Tabella 5.
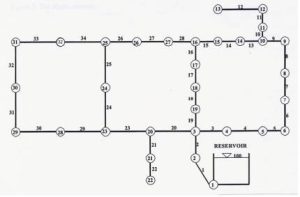
Figura 8 Schematic representation of the water network of Hanoi with relative numbering of nodes and elements
A roughness coefficient of 130 was used in the Hazen-Williams formula for the calculation of the network, the same value published and used by all the other researchers.
Tabella 6 shows the comparison between the loads calculated by the SuperNet model and the constraint loads imposed, while Tabella 7 reports the optimization results relating to the dimensioning of the different sections of the network with the SuperNet model.
Finally, Tabella 8 shows the comparison between the solutions obtained by the various researchers, using homogeneous data both as regards the unit costs of the pipelines and as regards the size of the network. it is important to note that, as in the previous NYTP case, other authors (Savic & Walters, 1997; Lippai et al., 1999; Wu et al .; Geem et al. [5]) have proposed cheaper solutions which have proved not eligible.
In this case the proposed model provides the best feasible solution obtained so far and, unlike the classical genetic models, the solution, which is in any case feasible, has been obtained with a very low computational effort.

Tabella 5 Disposal piping and related costs in the problem of designing the new Hanoi HP network

Tabella 6 Comparison between the calculated pressure values and those imposed as a constraint condition in the case of the design of the new Hanoi HP network. The values are the same as those used by other researchers

Tabella 7 Solution determined with SuperNet optimization model for Hanoi HP’s new network design problem. The total cost amounts to 6,065 [M $].

Tabella 8 Comparison of the solution obtained with the model proposed for the design problem of the new Hanoi HP network with that obtained in some previous studies, using homogeneous data both as regards the unit costs of the pipelines and as regards the size of the network. The solutions marked (*) then proved to be ineligible.
Conclusions
The SuperNet model was compared with the other algorithms proposed in the literature in two case studies, the first relating to the refurbishment of the New York network and the second to the new project of the Hanoi network. In both cases the results of the model demonstrate the exceptional qualities of the instrument which, unlike the purely genetic GA models, is however able to provide a solution with a minimum cost, however admissible, with a considerably reduced calculation time.
Bibliography
[1] Alperovits, E. & Shamir, U., “Design of optimal water distribution systems”, Water Resour. Res., 13(6), 885-900, (1977).
[2] Cunha, M. C. and Sousa, J., “Water Distribution System Design Optimization: Simulated Annealing Approach”, Journal of Water Resources Planning and Management, Vol. 125, No. 4,215-221, (1999).
[3] Dandy, G. C., Simpson, A. R. & Murphy, L. J., “An improved genetic algorithm for pipe network optimization”, Water Resources Research, Vol. 32, No. 2, 449-458, (1996).
[4] Fujiwara, O. & Khang, D. B., “A Two-Phase Decomposition Method for Optimal Design of Looped Water Distribution Networks”, Water Resources Research, Vol. 26, No. 4, 539-549, (1990).
[5] Geem, Z. W., Kim, J. H. & Loganathan, G. V., “A new heuristic optimization algorithm: Harmony Search”, Simulation, 76, 2, 60—68, (2001).
[6] Gessler, J., “Optimization of pipe networks”, Proc., International Symposium on Urban Hydrology, Hydraulics and Sediment Control, University of Kentucky, Lexington, Kentucky, 165-171, (1982).
[7] Lippai, I, Heaney, J. P. & Laguna M., “Robust Water System Design with Commercial Intelligent Search Optimizers”. J. of Computing in Civil Engrg, ASCE, Vol. 13, No.3,135-143, (1999).
[8] Morgan, D. R. & Goulter, I. C., “Optimal Urban Water Distribution Design”, Water Resorc. Res. 21(5), 642-652, (1985).
[9] Quindry, G. E., Brill, E.D., & Liebman, J.C., “Optimization of looped water distribution systems”, J. Environmental Engineering Division, ASCE, 107(EE4), 665-679, (1981).
[10] Schaake, J. C, & Lai, D., “Linear programming and dynamic programming application of water distribution network design“. Rep. 116, Hydrodyn. Lab., Dep. of Civ. .Eng., MIT. Press, Cambridge, Mass., (1969).
[11] Savic, D. A. & Walters, G. A., “Genetic Algorithms for the Robust, Least-cost Design of Water Distribution Networks”, J. Water Resour. Ping. and Mgnmt., ASCE, 123(2), 67-77, (1997).
[12] Wu, Z. Y. & Simpson, A. R., “A self-adaptive boundary search genetic algorithm and its application to water distribution systems”, Research Report, No. 140, J. of Hydraulic Research, Vol. 40 (2),191-203, (2002).
CASE STUDY 2: Optimized Design of Vamporazze (VI) irrigation plant with SuperNet
Figura 9 Irrigation plant in Vamporazze area, between the municipalities of Sandrigo and Bressanvido (VI).
Premessa
In collaboration with the Brenta Reclamation Consortium, CREA company has developed the executive design of a sprinkler irrigation system (Figura 9), including an area of 780 [ha] in the foothills in the municipalities of Sandrigo and Bressanvido (VI). Since the sliding irrigation systems adopted so far have led to a non-rational use of the water resource with a consequent significant depletion of local aquifers, the same project is proposed with a view to improving efficiency in the use of the available water resource.
For the design of the work, an attempt was made to use all the most technologically advanced calculation tools currently available on the market. More precisely, the Supernet mathematical model was used for the sizing of the pressure network, created by the research staff of CREA company, capable of minimizing the overall costs associated with both the readjustment of a pressure network and the construction, “ex novo “, of all or part of the network itself, and the energy consumption necessary for the management of the plant throughout the operating period, complying with certain operating constraints (minimum and maximum pressure at the delivery points of the flow) and taking into account, at the same time, multiple critical operating conditions of the system.
Characteristics of irrigation
The water supply originates from a derivation and adduction system with flowing water and constant flow rate. As a direct consequence, the exercise is bound to a continuous shift distribution of 24 [h] out of 24. Based on the cultivation needs and the podological characteristics of the land, the shift has been set at 10.25 [d].
In relation to the predominant land regime, characterized by small and medium-sized properties, it was decided to divide the irrigable areas into groups with a surface of about 10 [ha] each. The subdivision into rallies is shown in Figura 10.
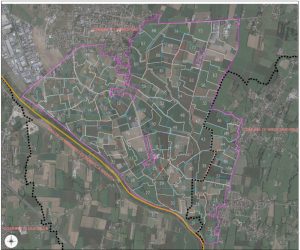
Figura 10 Subdivision into irrigation committees of the area affected by the project.
Irrigation system adopted
In this case, a semi-fixed irrigation system was adopted for economic and functional reasons, characterized by the fact that it has a fixed hydraulic network on the territory while the terminal part consists of mobile pipes (rolls), in plastic material, carried out on the ground and connected to the farm hydrants.
In the terminal part, the large rolls are equipped with a mouthpiece delivering the flow required for irrigation, with a variable sprinkling radius depending on the pressure on the mouthpiece. Subsequently, as soon as they have been watered down, they are disconnected and transported to another farm. The lengths of these pipes are variable depending on the type of areas to be irrigated.
Hydraulic optimization of the network
Distribution will take place, starting from a main supply network, through an open network of lower-order pipes. For the calculation of the flow rates, reference was made to the use of mobile sprinklers, each of which delivers a flow rate to be calibrated based on the size of the individual meetings through an irrigator, rotating on the sector itself.
The adductor network is divided into primary adductors and secondary adductors. The primary adductors connect the pumping station with the secondary adductors which, crossing the properties along the headlands or ditches, give users the possibility to connect their irrigation systems via hydrants protruding to the surface (Figura 11).
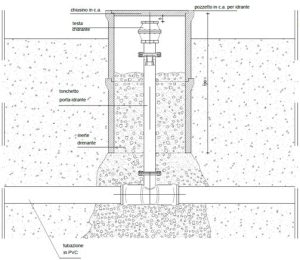
Figura 11 Detail of the irrigation hydrants to which the users’ systems will be connected.
Determination of the network operation scenarios
The calculation model of the SuperNet irrigation network, in addition to minimizing the overall costs of the network, allows to determine an optimal network solution capable of simultaneously complying with the constraint conditions relating to different operating scenarios. This feature was used in the case in question when a secondary conduct was devolved to the service of more than one meeting or when a single meeting was served by more than one secondary conduct. As can be easily understood, the simultaneous observance of several scenarios for the same network would have become extremely complicated, using traditional calculation tools.
Taking into account these particular watering conditions of the single meetings, 5 different network operating scenarios were in fact determined, simultaneously optimized by the mathematical model.
As regards the constraint conditions, a minimum load of 54.43 [m] has been imposed at each distribution point, in order to guarantee the correct functioning of the sprinklers.
Construction details of the network
The underground distribution network covers an area of 810 hectares and is made up of P.R.F.V. (fiberglass) and P.V.C. class PN 10, amply sufficient to withstand operating pressures. The use of steel pipes is also envisaged for road crossings and in the sub bed, where greater mechanical strength is required (Figura 12).
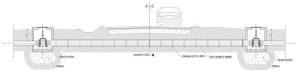
Figura 12 Detail of the road crossings made with steel pipes.
To carry out the dimensioning of the diameters, a turn-based irrigation method was provided for within each meeting, based on the flow rates calculated in relation to an average specific endowment of 0.56 [l / (s ha)] and taking into account the values imposed on the hydraulic losses in the same pipes to ensure a minimum piezometric load of 4.0 [atm] to the sprinklers placed in the most unfavorable points.
The scheme of the network is comb-like, with the primary supply pipes having decreasing diameters starting from the initial one Ø 700 [mm], corresponding to an initial flow rate of 595 [l / s], up to that of Ø 110 [mm] in correspondence of the terminal appendages of the network.
In particular, the entire irrigation network is divided into two main lines: the first line, consisting of the pipe called branch A, has a variable diameter from Ø 700 [mm] to Ø 110 [mm] and serves the western area of Vamporazze, higher altimetrically, with a flow rate of 272 [l / s]; the second line, consisting of the pipe called branch D, instead has a variable diameter from Ø 600 [mm] to Ø 110 [mm] and serves the eastern area of Vamporazze, which is less elevated from a height, with a flow rate of 323 [l / s] .
The network is completed by shutters, hydrants with flow limiters at 5.6 [l / s], concrete wells to protect the hydrants, shutters, special steel connecting pieces, automatic vents, bottom drains and steel pipes for road crossings and channels.
Figura 13 shows the positioning of the irrigation hydrants in the area located north-west of the system.
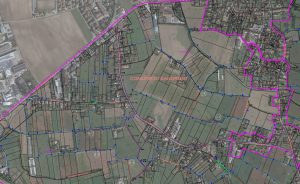
Figura 13 Positioning of irrigation hydrants in the area located at North-West.
CASE STUDY 3: Management of Mirese ACM network with WatMan
In this case study, the design of Mirese ACM (VE) western ridge aqueduct is presented with the use of WatMan management and simulation model, associated with the existing remote control, to establish sufficient operating pressure conditions in the affected area. . It is possible to observe the construction of the ‘physical model’ of the entire ACM network, confirmed by the comparison between the experimental data detected by the remote control and those obtained from simulations with the model.
Western ridge design of Mirese ACM network
The correct application of mathematical modeling to a complex system such that represented by Mirese acqueduct network (at disposal of a metropolitan area of 280.000 inhabitants) involves a series of problems of difficult solution, the same ones that constitute then, at the end, the true reasons for the failures endured using such informative systems.
Conscious of the difficulty of the job, in the activity carried out by CREA’s technicians no aspect has been neglected in order to reach all the previewed objectives, relating to both the optimal planning of the works, necessary to solve Mirese hydraulic problems, and the development of a ‘physical model’ (more than mathematician) of the same network.
The problem appears extremely complex since as much as complicated turns out to be ACM network intrinsic structure that, strongly interconnected, shows a total development of, approximately, 1894 [km] (Figura 14).
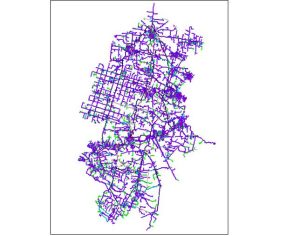
Figura 14 Mirese ACM aqueduct schematization. The network, at disposal of 280.000 inhabitants, has been schematized with the insertion of beyond 18000 branches and 20 plants (tanks, pumping stations, etc.) all interconnected.
The result obtained at the end of this job has been at least twofold. From one side, in fact, the characteristics of the hydraulic elements of the pressure network and/or the eventual accumulation basins corresponding to the minimum value of the overall work realization costs have been determined, in a position to guarantee, at the same time, both the regular distribution of the discharges with the pressures previewed in the planning phase and the correct management of the reservoirs in the maximum consumption day and, consequently, in all the possible situations. On the other side the same activity has allowed the setup of a mathematical model of the network updated to 2005, able to simulate nearly exactly the real physical system and give back an updated map of the leakage present in the network.
Practically, the present activity has been schematically subdivided in the following parts:
- Updating and calibration of the network mathematical model in the situation relative to 2005.
- Analysis of the actual situation in order to individuate the lacking branches of the existing aqueduct and the motivations at the base of such deficiencies.
- Individuation of a series of design hypotheses in a position to solve the pressure deficiency problems in the various zones of the aqueduct system.
Mirese ACM network ‘physical model’ setup
The first part of the job has consisted in reconstructing the Mirese 2005 network, starting from the updated schemas of the single municipality networks, in Dxf format, supplied by ACM Consortium besides using, at completion, the executive plans’ tablets in relation to some single interventions already carried out but not yet brought back on the Dxf files of the municipality networks.
The second phase of the job has regarded the adaptation of the topological structure and of the data bases relative to the hydraulic characteristics of the plants. The plants constitute, in fact, the neuralgic centers through which the Manager Agency directly controls the operation of the whole hydraulic system.
Not only the hydraulic schemas of all the plants have been controlled and updated but, between the other, the information relative to all the supervisory devices, pumps and motorized valves, in particular, the storage characteristics of tanks and earth basins, the absolute altitudes of the plants, etc., have been checked and introduced, too.
The network management in time happens through a series of supplied operational commands for pumps and motorized valves, interfaced with the Agency’s Operational Control Center through the presence of an opportune SCADA system. The preprocessor to the mathematical models PreNet allows an easy assignment of the manoeuvers to the supervisory devices in function of the settings imposed by prefixed maneuver plans, perfectly equal to those real ones, or in function of the values of measured pressure and/or level in network and plants.
The billed BAC consumptions (Billed Authorized Consumption), , and , have been distributed on the base of the data base present near the Mirese ACM Administrative Service.
Being NRW losses values (36.7 %) comparable to the effective billed consumptions, CREA’s technicians noticed that, wishing to realize a reliable network model, one could not neglect to model correctly the same ones. Based on the most recent experimental results found in literature (International Water Association, IWA), it has been developed before a theory and then a calculation procedure, introduced in the model structure, in order to distribute the losses starting from the pressure data, calculated in the network in function, also, of pipes’ material type. It is worth to emphasize that this innovative theory, since at the moment it does not exist any other model previewing it, constitutes a peculiarity of the overall realized system.
Mirese ACM network model calibration
The Geographic Informative System GIS of the network has appeared, finally, ready to face the mathematical models’ tests to verify the correctness of the simulation results in comparison to experimental data, measured by the same SCADA system.
The calibration process has been realized using WatMan management model, able to reproduce the Mirese network operations with a gradually varied motion conditions, executing the maneuvers imposed by SCADA telecontrol to the telecontrolled devices, pumps and valves.
The model calibration has been carried out in reference to a day particularly onerous for the operative conditions of the network, the 24/06/2005.
In relation to such day, like, on the other side, for every day of 2005, the data coming from telecontrol system relating to flows, levels and pressures, measured in the network plants, were available.
Following the ‘Theory of water losses’ (Garzon, 2006), the program developed from the CREA’s research department, starting from the values in continuous of the water resource introduced in ‘Rio San Martino’ production plant, from the values of input and output discharges measured in all the network plants, from the values of the levels in the tanks and from those ones of pressure measured in a specific point of the network (at ‘Saint Maria di Sala’), automatically determines the temporal consumption variation for each specific component.
In Figura 12 the temporal courses of the unitary coefficients’ tables are shown, associated to the nodal constraints of the model, in order to obtain the real space-time variations of the flows in the different points of water distribution.
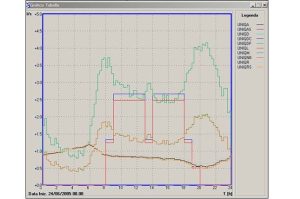
Figura 15 Temporal courses of the unitary coefficients’ tables, associated to BAC and NRW components of the model nodal constraints, in order to obtain the real space-time variations of the flows in the different points of water distribution.
To simulate the tanks’ emptying in some particular period of the day (circumstance present in many cases of the real physical system), opportune telecontrolled valves along the pipes in output from the basins have been introduced, able to carry out an automatic closure in the case in which the water depth had turned out null (empty basin).
The progressive closure of the tanks has been simulated analogously to what happens in the real physical system, in which the floater valves progressively close the income flow to the tanks in function of the water level present in the same basins, until complete closure at the moment of maximum level attainment.
In the cases in which valves partially closed by ACM technicians were present, to reproduce in the model the same operative conditions the loss coefficients have been opportunely modified. The loss coefficients for valves completely opened have been evaluated directly from experimental tests, in function of their relative typology. When such values were not available, the loss coefficients have been evaluated from the specialized literature (ex. IDEL’ CIK).
Once controlled the schematization of the plants, the calibration process of WatMan model is continued verifying the network outline.
With the precious support given by Mirese ACM experts, once again the network connections and the pipe diameters and materials have been controlled.
Slowly, at this point, the first likenesses between the model results and the experimental SCADA data have begun to appear. While the errors in the interconnections have been going to be corrected and, at the same time, some valves of the network have been closed because really closed in the real case, the results have been approaching more and more to the experimental reality. In this delicate passage of the calibration process it has been fundamental, between the other, to dispose of the model results for understanding the precise points of the network where to intervene in order to find eventual errors in the schematization.
When it is appeared obvious that the network schematization were not containing other errors or, at least, inaccuracies of certain relevance, a last step in the model calibration process has been consisted in searching the roughness values more indicated in relation to the materials and the diameters of the pipes. To this purpose it has been made an accurate research in literature in order to overwhelm this last gap. The roughness values for the pipes introduced in the model correspond exactly, in Coolebrook-White formula, to those mean indicated by the widest experimentations carried out by the more qualified research institutes in function of the different materials.
Comparison between the model results and the SCADA experimental data
Normally in order to execute the calibration some mathematical tools (least square optimization, genetic algorithms, Monte Carlo method, etc.) are used to distribute the losses and to determine the roughnesses of the pipes and relative diameters.
In case of Mirese network the distribution of NRW losses has been made on scientific base and that one of the roughness on experimental base (standard roughness coefficients). The control of the network and of the plants has been made on the basis of the experience of expert persons. At this point the results of the hard work are arrived by themselves, while the configuration of the network, of the plants and of telecontrol system have been arranged, demonstrating to have caught up nearly the ‘physical model’ of Mirese network rather than the mathematical model of the same one.
The last activity, actually very important, has been to refine the results previously obtained by WatMan model by means of the final recalibration of NRW components of losses differently from the described automatic procedure. In fact, taking into account the variation in time of the levels measured in the network tanks and their relative differences, still shown, comparing them with the model results, the NRW distribution components, therefore, have been locally modified by the CREA experts (approximately 8 [%] of total NRW). The maps of the reasonable distribution of the same losses, obtained at the end of this activity, have been supplied, together with the model, to the Manager Agency, because it provides for their repair where necessary.
The model calibration results are shown in Figura 16–Figura 19, in which the level variations in some telecontrolled reservoirs are shown, comparing the model result values to those effectively measured ones.
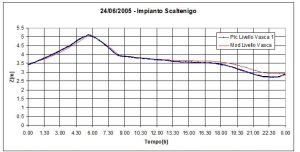
Figura 16 Scaltenigo earth basin (Vol. 10000 [m3]. Comparison between the SCADA system experimental data measured by the local PLC and the model results the day 24/06/2005. Scaltenigo earth basin is located in the neuralgic center of the overall Mirese aqueduct system and is regulated by two different bypasses on the income. It is possible to observe the optimal correspondence between the experimental values and those supplied by WatMan management model.
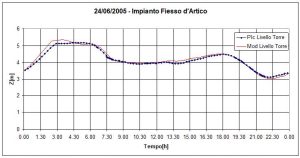
Figura 17 Fiesso d’Artico hanging reservoir (Vol. 1438 [m3]. Comparison between the SCADA system experimental data measured by the local PLC and the model results the day 24/06/2005. Fiesso d’Artico hanging reservoir is located in the most southern part of the western ridge of Mirese aqueduct system. Is possible to observe the amazing correspondence between the experimental values and those supplied by WatMan management model.
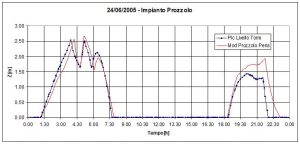
Figura 18 Prozzolo hanging reservoir (Vol. 988 [m3]. Comparison between the SCADA system experimental data measured by the local PLC and the model results the day 24/06/2005. Prozzolo hanging reservoir is located in the southern part of the eastern ridge of Mirese aqueduct system, bringing to Boion earth basin. Is possible to observe the optimal correspondence between the experimental values and those supplied by WatMan.
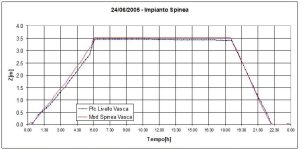
Figura 19 Spinea hanging reservoir (Vol. 3000 [m3]. Comparison between the SCADA system experimental data measured by the local PLC and the model results the day 24/06/2005. Spinea hanging reservoir is located in the central part of the eastern ridge of Mirese aqueduct system. Is possible to observe the optimal correspondence between the experimental values and those supplied by WatMan.
ACM network hydraulic restoring
Once calibrated, WatMan management model has been used in order to determine 3 different design solutions able to solve the pressure lack problem on ACM aqueduct western ridge.
The problem of this zone is really a complex issue. From the production center of Scorzè at Rio San Martino the western pipe, in Concrete Asbestos CA, having a DN 500 diameter, starts. The main adduction pipe, constituting the western ridge in ACM Mirese aqueduct outline, in Capitelmozzo locality, at North of Noale, at first becomes a DN 450 before becoming, at South of Noale, a DN 400 pipe.
Diameter DN 450, and still more DN 400, of the pipe, in particular, appear clearly insufficient to carry on the discharge of beyond 220 [l/s] flowing along the western ridge. The consistent discharge is required, downstream, by inhabited centers of sure importance like Santa Maria di Sala and, more downstream, Fiesso d’Artico and Strà.
The design solutions individuated and, therefore, inquired have been the following:
- potentiation of the western ridge, doubling the same pipe line in the branch comprised between Noale and Mellaredo, building a new pipe, parallel to the existing one, of total length equal to 10460 [m], whose 7500 [m] made by a DN 400 pipe and the remaining by an other DN 350 pipe (5.000.000 Є);
- construction of an earth basin near Veternigo, supplied by an opportune pumping station (1.500.000 Є);
- construction of a booster in line near Veternigo, in the same position where the construction of the earth basin of the previous solution has been previewed (125.000 Є).
Apart from all the solutions over shown, having a sustentation function for the pressure in Mellaredo zone, the insertion of a regulation valve (PRV), controlling the upstream pressure near Cavinelli Street, at Pianiga, has been previewed.
The three solutions have been opportunely designed in order to solve, in any case, the pressure problems in the western ridge of Mirese pressure network.
In particular a solution has been determined, Solution 3 (corresponding to the booster in line in Veternigo zone and a PRV valve to regulate the upstream pressure in Pianiga zone), in a position to optimize the design, saving, in comparison with all the others, literally million of euro to the Customer for the work realization and its maintenance. Not being necessary to carry down the pressure value to the soil level, like in case 2 of the earth basin, the pressure conditions in the pipes placed upstream the booster in line are considerably greater. This same pumping plant will be, moreover, supplied by a bypass in order to avoid lifts when these were not effectively required (eventually in winter months, when water consumption is reduced).
Significant References
- Mathematical model of the water distribution network of the Municipality of Pellestrina as part of the aqueduct system of the Veritas company (2008, Veritas Spa (VE)).
- Mathematical model of the Peschiera del Garda aqueduct (VR) (2006, AGS Consortium (VR)).
- General project relating to the restoration of the Mirese ACM aqueduct (2006, ACM (VE)).
- Hydraulic mathematical model of the water network of Chiampo (VI) aimed at finding leaks in the network (2002, Consorzio Acque del Chiampo (VI)).
- Hydraulic mathematical model of the Ghisalba aqueduct network (BG) aimed at finding leaks in the network (2001, Consorzio Bacino del Serio (BG)).
- Optimal design by minimizing the construction costs of the Spello (PG) aqueduct network (1999, ENEL-HYDRO).
- Evaluation of the phenomena of various motion for the adduction network of the irrigation system in a hilly area in the municipalities of Marostica and Pianezze (1999, Consorzio Pedemontano Brenta (PD)).